
On the EarthTime website, comparisons can be made between 1984 and 2016 on topics such as ocean growth and deforestation. You’d be surprised to see how much the world has changed in the last 34 years. As a society, we have changed our habits, the products we consume and even the way we communicate. EarthTime shows how the environmental degradation has increased during the time, along with the effects of climate change, deforestation, coral bleaching, and so on.
The technological levels reached today would be unimaginable for a person of several decades ago. However, while we have made progress in many areas, there are real concerns today, such as climate change. That’s why the EarthTime platform is now available to tell us about this necessary but uncomfortable topic.
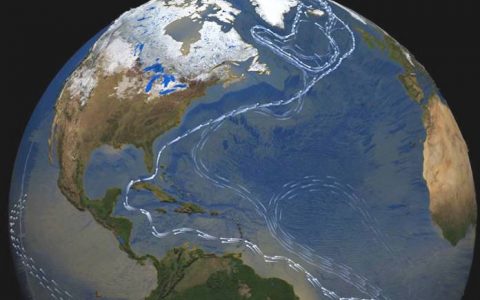
The EarthTime platform was developed by CREATE Lab in conjunction with the World Economic Forum on Earth Day. In it, you can see a world map that compares data on the planet between the years of 1984 and 2016. Among them, there are records of deforestation, rising ocean levels due to temperature, coral bleaching, trade routes, urban growth, and so on.
Among the project’s partners is NASA, which provided the images taken from space. The World Bank, the United Nations International Renewable Energy Agency, the World Wildlife Fund (WWF), and several universities and educational centers around the world also shared information and helped with the research.
How to use EarthTime?
The map can be accessed from its home page by selecting “Browse”. Once there, you can see that, at the bottom, there is a timeline. It can be played back to function as a GIF, quickly showing the sequence of images from 1984 to 2016.
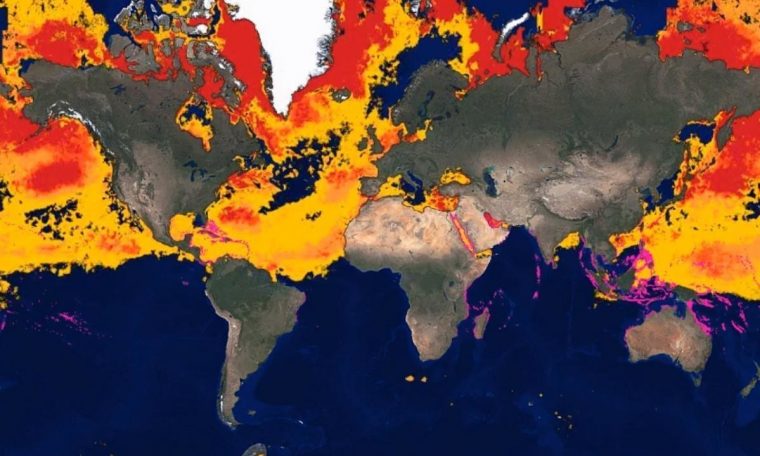
At the top, there are several tabs. If you open “Data Library”, several categories will be displayed such as climate change, corals, energy, deforestations, urbanization, and water.
Within each category, you can select several options that will color areas of the map and compare between years. For example, if we select “Forests”, and “Forest Loss/Gain”, we will see large red spots in South America.
These points are where the Amazon rainforest has been torn down to make way for crops in Brazil.
In conclusion, EarthTime offers a simple way to observe the changes our planet went through between 1984 and 2016, triggering an alarm sign on climate change, environmental degradation, coral bleaching, and so on.